Physical Address
304 North Cardinal St.
Dorchester Center, MA 02124
Physical Address
304 North Cardinal St.
Dorchester Center, MA 02124

Explore practical guides and tools for Microsoft 365, Azure, and PowerShell. Enhance your cloud security and admin skills with expert insights and automation tips.
Explore practical guides and tools for Microsoft 365, Azure, and PowerShell. Enhance your cloud security and admin skills with expert insights and automation tips.

In this final part of the series, we move from exploration to visualization , building a complete Intune Dashboard that consolidates all the essential device metrics your IT and security teams need.
While the first two parts covered :
👉 Part 3 ties everything together into a single automated report that transforms raw Intune data into a dynamic HTML dashboard with real-time statistics and charts.
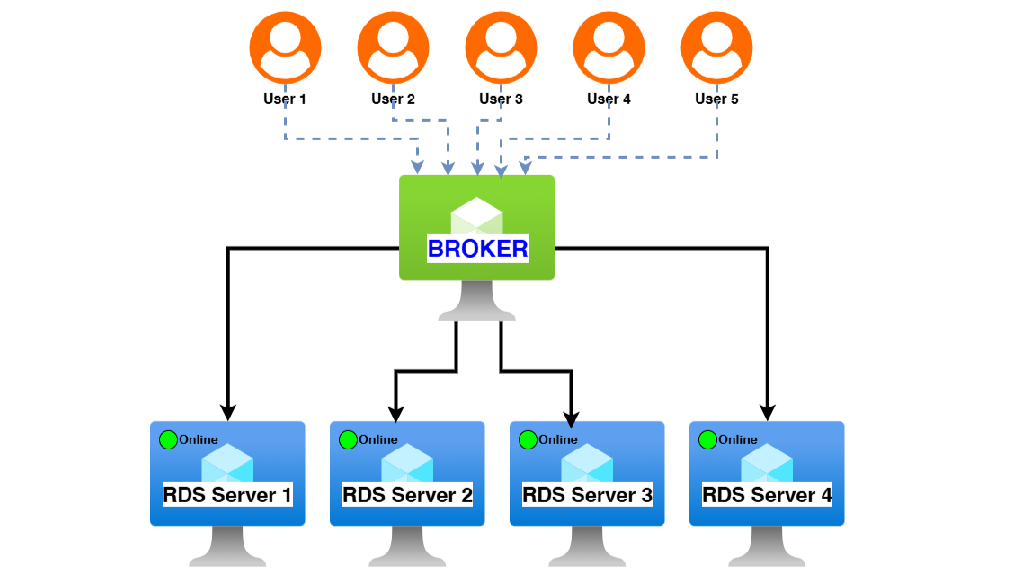
The script uses Microsoft Graph API (via an Azure AD App Registration) to securely connect to Intune and retrieve data about all managed devices.
It then automatically generates a web-based dashboard using the PSWriteHTML PowerShell module.
The result:
A clean, visual report that can be opened in any browser, showing compliance, security, and inventory insights — like this 👇
📊 (see sample dashboard screenshot below)
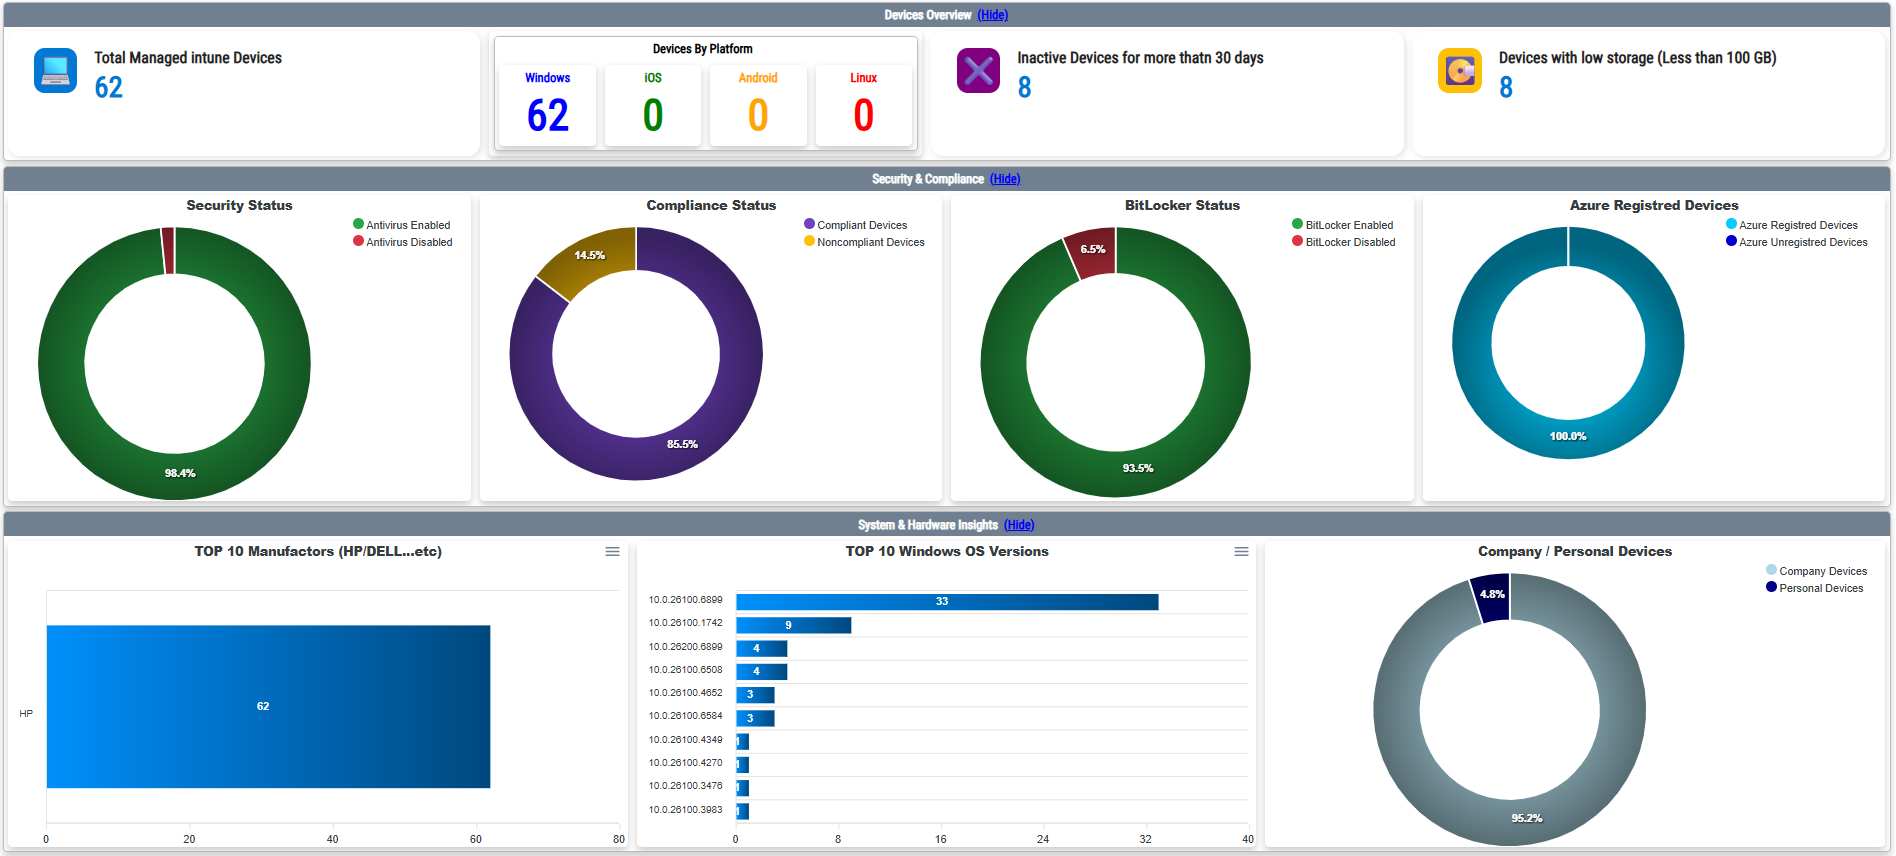
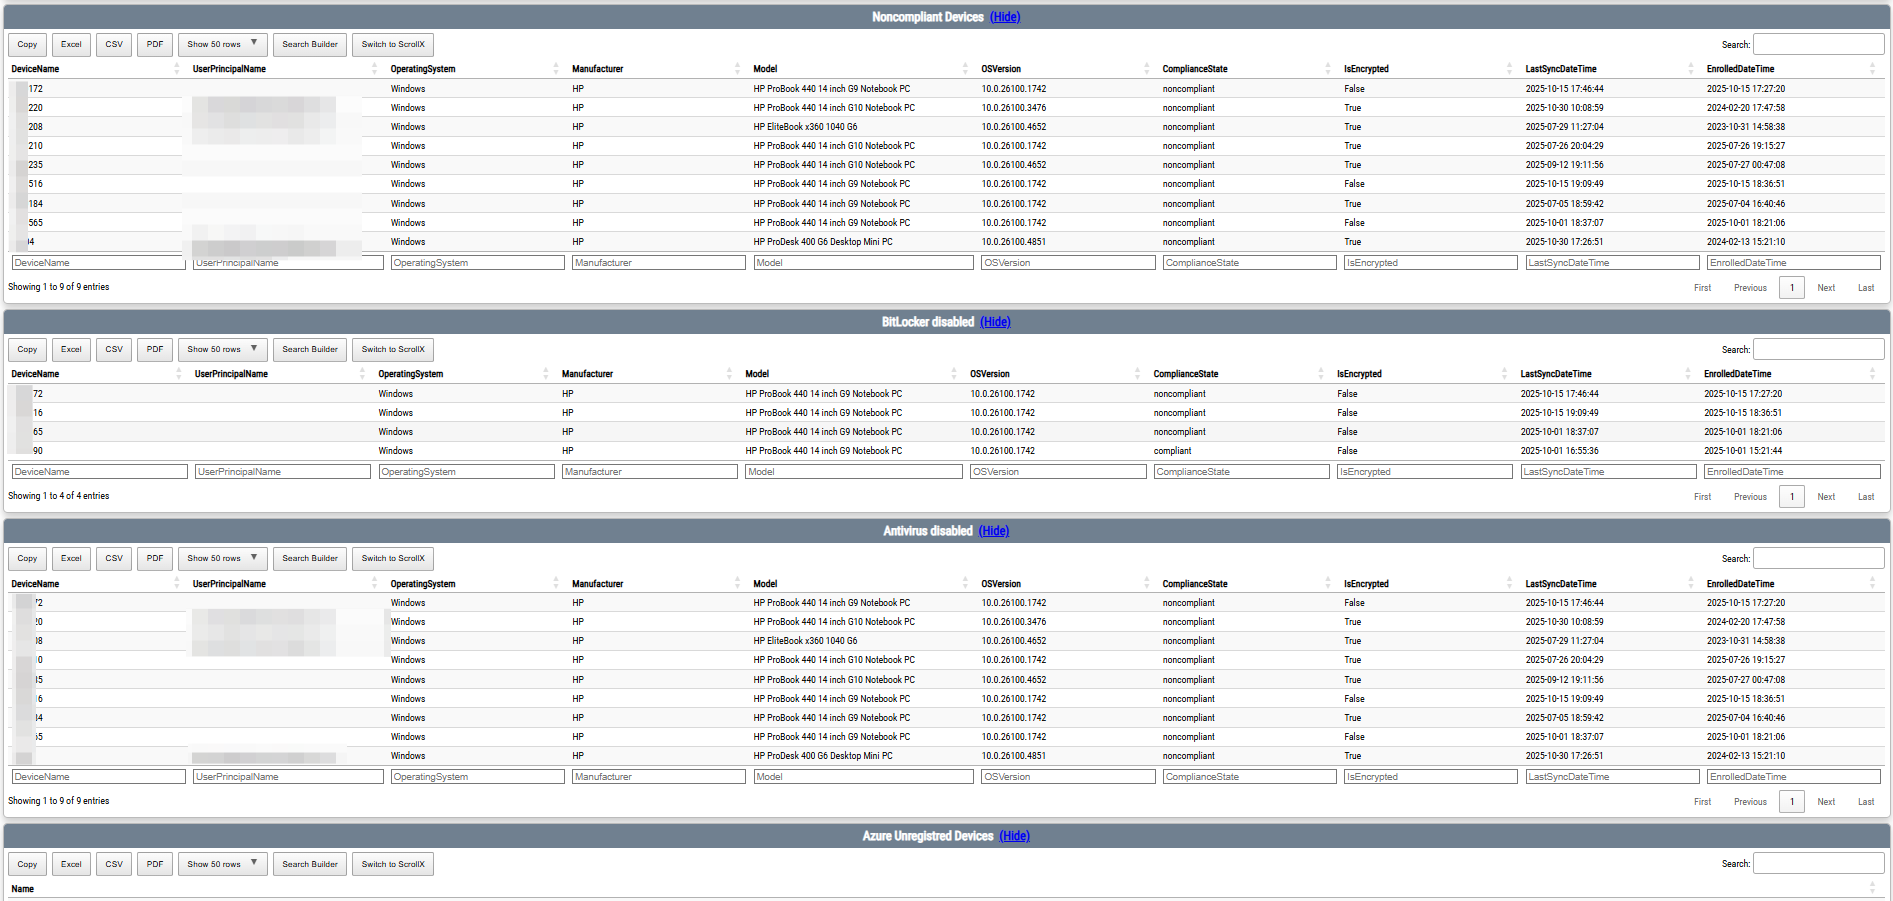
The dashboard provides both high-level KPIs and detailed analytics across multiple areas:
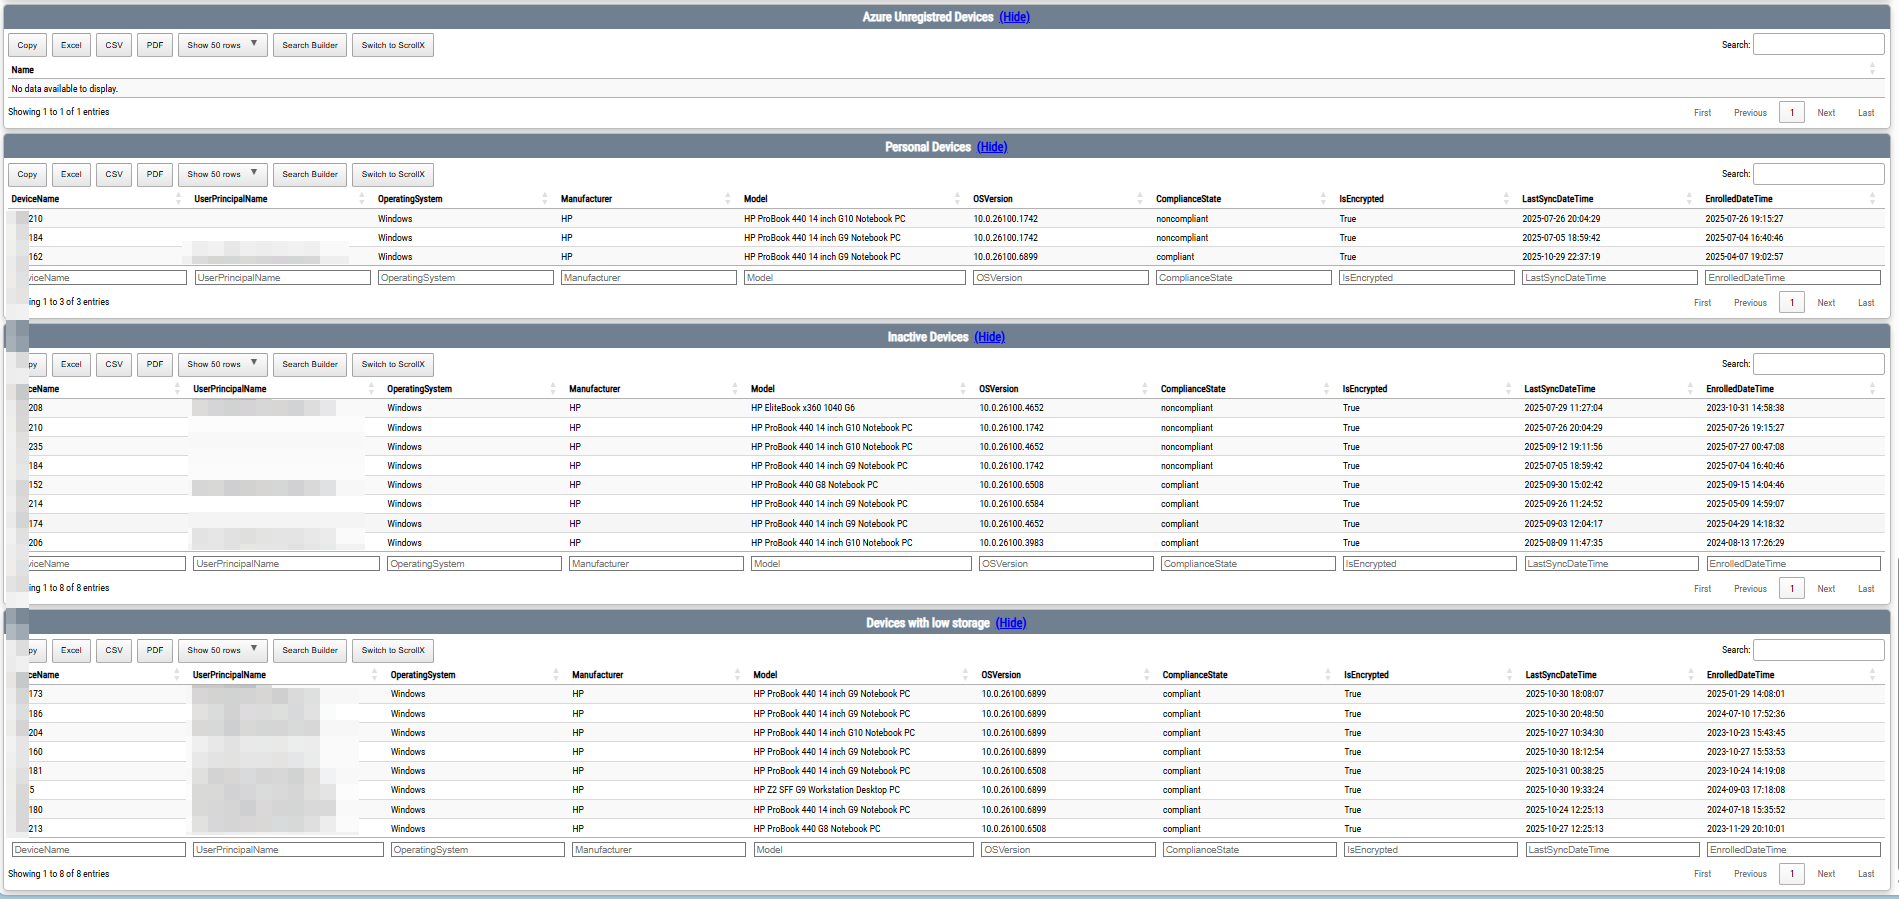
All tables are searchable and filterable with :DeviceName, UserPrincipalName, OSVersion, Manufacturer, ComplianceState, Encryption, LastSyncDateTime, EnrollmentDate
All results are exportable to PDF, CSV
This script will generate HTML file in this location : C:\Temp\Intune-Dashboard.html
You can get the PowerShell script from my Github :